
Finance for HR: UNDERSTANDING FINANCIAL INFORMATION
The Balance Sheet
THE BALANCE SHEET IS A representation of the company’s financial health. It is produced as of a specific point in time, usually the end of the fiscal (accounting) year or month. It lists the assets that the company owns and the liabilities that the company owes to others; the difference between the two represents the ownership position (stockholders’ equity). More specifically, the balance sheet tells us about the company’s:
Liquidity: The company’s ability to meet its current obligations.
Financial health: The company’s ability to meet its obligations over the long term; this concept is similar to liquidity except that it takes a long-term perspective. It also incorporates strategic issues.
Financial strength refers to the company’s ability to:
- Secure adequate resources to finance its future
- Maintain and expand efficient operations
- Properly support its marketing efforts
- Use technology to profitable advantage
- Successfully compete
The balance sheet also helps us to measure the company’s operating performance. This includes the amount of profits and cash flow generated relative to:
- Owners’ investment (stockholders’ equity)
- Total resources available (assets)
- Amount of business generated (revenue)
By analyzing the data in the balance sheet, we can evaluate the company’s asset management performance. This includes the management of:
- Inventory, measured with an inventory turnover ratio
- Customer credit, reflected by an accounts receivable measure known as days sales outstanding or collection period
- Total asset turnover, which reflects capital intensity, degree of vertical integration, and management efficiency
Mathematical formulas called ratios are very valuable in the analytical process. They should be used to compare the company’s current performance against:
- Its standards of performance (budget) Its past history (trends)
- The performance of other companies in a similar business (benchmarking)
Look at the balance sheet of the Metropolitan Manufacturing Company, shown in Exhibit 1-1, dated as of December 31, 2002. Notice that it also gives comparable figures for December 31, 2001. Providing the information for the prior year is called a reference point. This is essential for understanding and analyzing the information and should always be included. The third column gives the differences in the dollar amounts between the two years. This information summarizes cash flow changes that have occurred between December 31, 2001, and December 31, 2002. This very critical information is presented more explicitly in the report called the sources and uses of funds statement or the statement of cash flows. (The numbers in parentheses in the fourth column refer to the lines in Exhibit 3-1, the Sources and Uses of Funds Statement.)
Exhibit 1-1. Metropolitan Manufacturing Company, Inc.
Comparative Balance Sheets
December 31, 2002 and December 31, 2001 ($000)
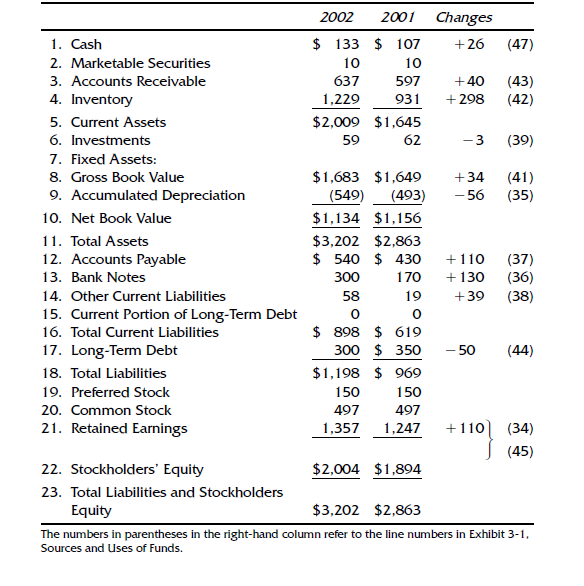
The numbers in parentheses in the right-hand column refer to the line numbers in Exhibit 3-1, Sources and Uses of Funds.
Expenses and Expenditures
Before we look at the balance sheet in detail, we need to understand the difference between the concepts of expenses and expenditures. Understanding this difference will provide valuable insights into accounting practices.
An expenditure is the disbursement of cash or a commitment to disburse cash—hence the phrase capital expenditure. An expense is the recognition of the expenditure and its recording for accounting purposes in the time period(s) that benefited from it (i.e., the period in which it helped the company achieve revenue).
The GAAP concept that governs this is called the matching principle: Expenses should be matched to benefits, which means recorded in the period of time that benefited from the expenditure rather than the period of time in which the expenditure occurred.
The accounting concepts that reflect this principle include the following:
- Depreciation
- Amortization
- Accruals
- Reserves
- Prepaid expenses
Suppose a company buys equipment (makes a capital expenditure) for $100,000. The company expects the equipment to last (provide benefit) for five years. This is called the equipment’s estimated useful life. Using the basic concept called straight-line depreciation (to be discussed later in this chapter), the depreciation expense recorded each year will be:
$100,000 / 5 = $20,000
Each year there will be an expense of $20,000 on the company’s income statement. Clearly during those five years, no such cash expenditures were made.
Assets
The assets section of the balance sheet is a financial representation of what the company owns. The items are presented at the lower of their purchase price or their market value at the time of the financial statement. Assets are listed in the order of their liquidity, or the ease with which they can be converted to cash.
1. Cash, $133,000
Cash is the ultimate measure of a organization’s short-term purchasing power, its ability to pay its debts and expand and modernize its operations. It represents immediately available purchasing power. This balance sheet category principally consists of funds in checking accounts in commercial banks. This money may or may not earn interest for the company. Its primary characteristic is that it is immediately liquid; it is available to the firm now. This may also be called Cash and Cash Equivalents. Cash equivalents are securities with very short maturities, perhaps up to three months, that can earn some interest income for the company.
2. Marketable Securities, $10,000
This category includes the short-term investments that companies make with cash that will not be needed within the next few weeks or months. As a result of intelligent cash planning, the company has the opportunity to earn extra profit in the form of interest income from these securities. Some companies earn sizable returns on this money through careful cash management and intelligent investment strategies. The securities that can be placed in this category include certificates of deposit (CDs), Treasury bills, and commercial paper. All have very short maturities, usually 90 to 180 days. CDs are issued by commercial banks, Treasury bills are issued by the government (for example in US), and commercial paper is issued by very large, high-quality industrial corporations. Purchasing these high-quality securities, which have little or no risk, gives the company the opportunity to earn a few percentage points on the money it does not need immediately.
3. Accounts Receivable, $637,000
When a company sells products to customers, it may receive immediate payment. This may be done through a bank draft, a check, a credit card, a letter of credit, or in the case of a supermarket or retail store, cash. On the other hand, as part of the selling process, the customer may be given the opportunity to postpone paying for the products or services until a specified future date. This is referred to as giving the customer credit. The accounting term that describes the dollar amount of services provided or products delivered that have not yet been paid for by the customer is accounts receivable. This is the amount of money owed to the company for products and services that it has already provided but for which payment has not yet been received. It is expected that this money will be received sometime within a 30-to 60-day time period. In order to have accounts receivable, the company needs to have achieved revenue. Revenue is the amount of money that the company has earned by providing products and services to its customers. Sometimes cash is received before revenue is earned, as when a customer makes a down payment. Retail stores usually receive their cash when they earn the revenue. However, most corporations receive their cash after they earn their revenue, resulting in accounts receivable.
4. Inventory, $1,229,000
This represents the financial investment that the company has made in the manufacture or production (or, in the case of a retail store, the purchase) of products that will be sold to customers. For manufactured goods, this amount is divided in three categories: finished goods, work in process, and raw materials.
Finished Goods. These are fully completed products ready for shipment to customers. The amount shown on the balance sheet includes the cost of purchased raw materials and components used in the products, the labor that assembled the products at each stage of their manufacture (called direct labor), and all of the support expenditures (called manufacturing overhead) that helped to add value to the product. Products in this category continue to be owned by the company, and thus to be assets of the company, until they are delivered to the customer’s premises or the customer’s distribution network (vehicles, warehouse) and the customer agrees to take responsibility for them (the customer accepts delivery).
Work in Process. Inventory in this category has had some value added by the company—it is more than raw materials and components—but it is not yet something that can be delivered to the customer. If the item has been the subject of any activity by the production line, but is not yet ready for final customer acceptance, it is considered work in process.
Raw Materials. Raw materials are products or components that have been received from vendors or suppliers to which the company has done nothing except receive them and place them into storage for future use. Since the company has not yet put the raw materials into production, no value has yet been added. The amount presented in this category may include the cost of bringing the product from the vendor to the company’s warehouse, whether this freight cost is paid separately, itemized in the vendor’s invoice, or just included in the purchase price.
5. Current Assets, $2,009,000
This is the sum of the asset classifications previously identified: cash, marketable securities, accounts receivable, and inventory, plus a few other, more minor categories. It represents the assets owned by the company that are expected to become cash (liquid assets) within a one-year period.
Presentation of Current Assets
Accounts receivable is usually presented net of an amount called allowance for bad debts. This is a statistically derived estimate of the portion of those accounts receivable that may not be collected. It is based on an analysis of the company’s past experience in collecting funds. This estimate is made and the possibility of uncollected funds recognized even though the company fully expects the balance of every individual account in its accounts receivable list to be collected. All of the amounts in the accounts receivable balance were originally credit extended to creditworthy customers who were expected to pay their bills on time—otherwise credit would not have been extended. However, it is possible that some of this money will not be collected. Allowance for bad debts is usually in the range of 1 to2 percent of accounts receivable. The amount is determined by the company’s internal accounting staff and is reviewed and revised annually within the context of actual collections experience.
For Metropolitan Manufacturing Company, the calculation of net accounts receivable is as follows:
Accounts Receivable $647,000
Allowance for Bad Debts (10,000)
Accounts Receivable (net) $637,000
Accounting for inventory also has some specific characteristics of which the reader should be aware. The figure given for inventory is the amount it cost the company to buy the raw materials and components and to produce the product. The amounts presented are based on the accounting principle lower of cost or market. If the economic value of the inventory improves because of selling price increases, because of other market conditions, or because the cost of replacing it has increased, the inventory figure on the balance sheet does not change. Inventory is presented at cost, which is lower than market value at that point in time. However, if the value of the inventory decreases because selling prices are soft or because the prospects for its sale have significantly diminished, then the balance sheet must reflect this deteriorated value. In this case, where market value is below cost, the inventory amounts will be presented at market.
The accounting process necessary to reflect this latter condition is called a writedown. The company would be required to write down the value of the inventory to reflect the reduced value.
6. Investments (and Intangible Assets), $59,000
There are a number of possible components of these two categories. They include:
- Ownership of other companies
- Partial equity stakes in other companies, including joint ventures
- Patents
- Trademarks
- Copyrights
- Goodwill
This information is also presented at the lower of cost or market. If the market value of a patent increases by millions of dollars above what the company paid for the right to use it or develop it, this very positive business development will not be reflected on the balance sheet. However, if the asset proves disappointing or if it proves to be without value, this must be reflected by a write- down or write-off. It is not the responsibility of accounting to reflect improved economic value of assets, regardless of the business certainty of that improvement.
7. Fixed Assets
Fixed assets are assets owned by the company and used in the operation of its business that are expected to last more than one year. They are sometimes called tangible assets. They often represent a substantial investment for the company. Included in this category are:
Land: This land can be the site of an office, factory, or ware house, or it may be vacant and available for future use.
Buildings: This includes any structures owned by the company, such as factories or other production facilities, offices, warehouses, distribution centers, and vehicle parking and repair facilities.
Machinery and equipment: This category includes all production machinery, office equipment, furniture and fixtures, computers, and any other tangible assets that support the operations of the company.
Vehicles: Trucks (tractors and trailers), company cars used by salespeople or other managers, and rail cars owned by the company are included in this category.
In order to reduce (somewhat) the accounting burden, companies are permitted to identify a threshold amount below which an item will be recorded as an expense on the company’s income statement, even though the item is expected to provide benefit for more than one year, is tangible, and therefore would otherwise be considered a fixed asset.
This threshold amount can be as much as several thousands of dollars. Thus, if the company buys a single desk for $1,000, it may be considered an expense and charged to the budget accordingly. However, if the company buys twenty of these desks (and the accompanying chairs), the purchase will be recorded as a capital expenditure and the desks treated as a fixed asset on the balance sheet.
8. Gross Book Value, $1,683,000
This records the original amount paid, at the time of purchase, for the tangible assets that the company currently owns, subject to the lower of cost or market accounting rule. This amount never reflects improved economic value, even if, for example, a piece of real estate was purchased thirty years previously and its market value has greatly increased.
9. Accumulated Depreciation, ($549,000)
This is sometimes called the Reserve or Allowance for Depreciation. It is the total amount of depreciation expense that the company has recorded against the assets included in the gross book value. When tangible assets are purchased and recorded on the balance sheet as fixed assets, their value must be allocated over the course of their useful life in the form of a noncash expense on the income statement called depreciation. When the asset is purchased, its useful or functional life is estimated. Using one of several accounting methodologies, the gross book value is then apportioned over that time period, with the resultant annual amount being called depreciation expense. The accumulated depreciation amount shown on the balance sheet tells us how much has been recorded so far. The concept of an expense being noncash is explored later in this chapter.
10. Net Book Value $1,134,000
This is the difference between the gross book value and accumulated depreciation amounts. It has little, if any, analytical significance.
11. Total Assets $3,202,000
This is the sum total of current assets, the net book value of fixed assets, investments, and any other assets the company may own.
Important Accounting Concepts Affecting the Balance Sheet
Expense and Expenditure
These are distinctly different concepts. Understanding this will provide valuable insights into accounting practices. An expenditure is the disbursement of cash or a commitment to disburse cash. Hence the phrase ‘‘capital expenditure.’’ An expense recognizes the expenditure but records it for accounting purposes in the time period(s) that benefited from it, i.e., help the company achieve revenue. A basic example is a company that in May pays the rent covering the month of June. The expenditure is in May but the expense is in June because that was the period of time that benefited. The GAAP concept that governs this is the matching principle. Expenses should be matched or recorded in the period of time that benefited from the expenditure rather than when the expenditure occurred.
The accounting concepts that are affected by this principle include:
- Depreciation
- Amortization
- Accrual
- Reserve
- Prepaid expense
Accounting for Fixed Assets
Income Statement
Balance Sheet (annual expense)
Year 1
Gross Book Value $100,000 Depreciation $20,000
Accumulated Depreciation (20,000) Expense
Net Book Value $80,000
Year 2
Gross Book Value $100,000 Depreciation $20,000
Accumulated Depreciation (40,000) Expense
Net Book Value $60,000
In this case, the company makes a capital expenditure of $100,000. The gross book value on the balance sheet will be $100,000. This is a record of what the company paid for the asset when it was purchased. During the first year, the annual depreciation expense on the income statement will be $20,000. The accumulated depreciation on the balance sheet is the total amount of depreciation expense included on the income statement from the time the fixed asset(s) were purchased. The net book value is the difference between the two. Notice that the gross book value remains the same in Year 2. This amount may increase if significant enhancements are made to the asset, or it may decrease if the asset’s value deteriorates, resulting in a writedown. Generally, however, this amount will remain the same throughout the entire life of the asset. The accumulated depreciation in Year 2 is the sum total of the depreciation expenses recorded in Years 1 and 2. It is cumulative.
In Year 5, and for as long after that as the asset is useful, it will remain on the balance sheet as:
Gross Book Value $100,000
Accumulated Depreciation (100,000)
Net Book Value 0
The asset no longer has any ‘‘book’’ value. It is said to be fully depreciated. Its value to the business, however, may still be substantial. When the asset is ultimately retired, its gross book value, accumulated depreciation, and net book value are removed from the balance sheet.
Depreciation Methods. The most common method of depreciation is called straight-line. It basically involves dividing the gross book value by the number of years in the useful life of the asset. In this example, the annual depreciation expense will be:
$100,000 / 5 years = $20,000
There are three other methods that are often used. They are:
- Double-declining-balance
- Sum-of-the-years’-digits
- Per-unit calculation
Double-declining-balance. Notice that in straight-line depreciation, depreciation expense for an asset with a 5-year life is 20 percent times the gross book value. (If the depreciable life were different from5years, the calculation would change.) In the double-declining-balance method, the initial calculation is made in the same way (in this case, $100,000 ÷ 5 years = $20,000, or 20 percent of $100,000), but the percentage is doubled, in this case to 40 percent, and the resulting percentage is multiplied by the net book value. The calculation of the depreciation expense based upon a gross book value of $100,000 is as follows:
Depreciation
Expense
Year Net Book Value x 40% Remaining Balance
1 $100,000 x 40% = $40,000 $100,000 – $40,000 = $60,000
2 $60,000 x 40% = $24,000 $60,000 – $24,000 = $36,000
3 $36,000 x 40% = $14,400 $36,000 – $14,400 = $21,600
4 $21,600 ÷ 2 = $10,800 $10,800
5 $10,800
$100,000
Notice that the first year’s depreciation expense is double the amount it would have been using the straight-line method. Also, when the annual expense becomes less than what it would have been under the straight-line method, the depreciation reverts to straight-line for the remaining years. This method is selected by some companies for tax purposes. The first and second years’ expense is higher than what straight-line would have yielded, so the tax savings in those years will be higher.
Sum-of-the-years’-digits. In this method, numbers representing the years are totaled, then the order of the numbers is inverted and the results are used to calculate the annual depreciation expense. The calculations are as follows:
1 + 2 + 3 + 4 + 5 = 15
Year Annual Expense
- $100,000 x 5/15 = $ 33,333
- $100,000 x 4/15 = $ 26,666
- $100,000 x 3/15 = $ 20,000
- $100,000 x 2/15 = $ 13,334
- $100,000 x 1/15 = $ 6,667
$100,000
This method results in a depreciation expense for the first two years that is higher than the depreciation expense using straight- line but lower than that provided by the double-declining balance method.
Per-unit. The third depreciation method involves dividing the cost of the fixed asset by the total number of units it is expected to manufacture during its useful life. If a machine is expected to produce 200,000 units of product over its useful life, the per-unit depreciation expense will be calculated as follows:
$100,000 ÷ 200,000 units = $0.50 per unit
If production during the first year is 60,000 units, the annual expense for that first year will be 60,000 x $0.50 = $30,000. In most manufacturing standard cost systems, the depreciation expense per unit is built into the manufacturing overhead rate or burden. In all methods of calculating depreciation, accounting principles are not compromised. To summarize:
- Useful life determines the number of years.
- Consistency is required.
- The total of the depreciation expense is usually equal to the original investment.
Accounting for Inventory: LIFO Versus FIFO
Accountants in a company that manufactures or sells products are required to adopt a procedure to reflect the value of inventory. The two procedures that are most commonly used are known as LIFO and FIFO, which stand for last-in, first-out and first-in, first-out. You should understand that this is purely an accounting concept. It does not affect the physical management of the product in any way. An example can best illustrate this.
A company purchases 600 units of product at the following prices:
Units Price Expenditure
100 units @ $1.00 each $ 100.00
200 units @ $2.00 each $ 400.00
300 units @ $3.00 each $ 900.00
600 units $1,400.00
Now suppose that 400 units are sold and 200 units remain in inventory. The accounting questions are:
What was the cost of the goods that were sold? And what is the value of the inventory that remains?
Under LIFO, the goods that were purchased last are assumed to have been sold first. Therefore, the cost of goods sold (COGS) would be $1,100 and inventory would be $300, calculated as follows:
Cost of Goods Sold:
300 units x $3.00 = $ 900
100 units x $2.00 = $ 200
COGS 400 units = $1,100
Inventory: 100 units x $2.00 = $200
100 units x $1.00 = $100
Inventory 200 units $300
Under FIFO, the goods that were purchased first are assumed to have been sold first. Therefore, the cost of goods sold would be $800 and inventory would be $600, calculated as follows:
Cost of Goods Sold:
100 units x $1.00 = $100
200 units x $2.00 = $400
100 units x $3.00 = $300
COGS 400 = $800
Inventory:
200 units x $3.00 = $600
Companies may also identify the actual cost of each unit, if this can be readily done, or calculate a running average. In this example, if a running average were calculated, the per-unit value of both COGS and inventory would be:
$2.33 x $1,400/600 units
This gives a value of $933 for cost of goods sold and $467 for inventory.
Liabilities
Liabilities are the amounts that the company owes to others for products and services it has purchased and amounts that it has borrowed and therefore must repay.
Current liabilities include all monies that the company owes that must be paid within one year from the date of the balance sheet. Long-term liabilities are those that are due more than one year from the date of the balance sheet. Included in current liabilities are accounts payable, short-term bank loans, and accrued expenses (which we have included in other current liabilities). There are no issues of quality in these classifications, only time. The current liabilities and current assets classifications are time- referenced.
12. Accounts Payable, $540,000
Accounts payable are amounts owed to vendors or suppliers for products delivered and services provided for which payment has not yet been made. The company has purchased these products and services on credit. The suppliers have agreed to postpone the receipt of their cash for a specified period as part of their sales process. Normally this money must be paid within a 30-to 60-day time period.
13. Bank Notes, $300,000
This amount has been borrowed from a commercial bank or some other lender and has not yet been repaid. Because the amount must be repaid within one year, it is classified as a current liability.
14. Other Current Liabilities, $58,000
This category includes all short-term liabilities not included in other categories; they are primarily the result of accruals. At any given point in time, the company owes salaries and wages to employees, interest on loans to banks, taxes, and fees to outsiders for professional services. For example, if the balance sheet date falls on a Wednesday, employees who are paid at the end of each week have worked for three days as of the balance sheet date, and so the company owes them three days’ pay. To reflect the existence of these debts, the company estimates their amounts as of the balance sheet date and records them in an account called accrued expenses. The total amount of these charges is recorded on the income statement as an expense, while the liability for this expense is part of ‘‘other current liabilities.’’
15. Current Portion of Long-Term Debt
This category includes liabilities that had a maturity of more than one year when the funds were originally borrowed, but that now, because of the passage of time, are due in less than one year.
16. Total Current Liabilities, $898,000
This is the total of all the funds owed to others that are due within one year of the date of the balance sheet. It includes accounts payable, short-term loans, other current liabilities, and the current portion of long-term debt.
17. Long-Term Debt, $300,000
Long-term debt is amounts that were borrowed from commercial banks or other financial institutions that are not due until some time beyond one year. Their maturity ranges from just over one year to perhaps twenty or thirty years. This category may include a variety of long-term debt securities, including debentures, mortgage bonds, and convertible bonds. It may also include liabilities to tax authorities, including the IRS, states, and foreign governments.
Stockholders’ Equity, $2,004,000
Stockholders’ equity represents the cumulative amount of money that all of the owners of the business have invested in the business. They accomplished this in a number of ways. Some of them purchased preferred shares from the company.
For Metropolitan Manufacturing Company, the cumulative amount that these investors put in is $150,000. Other investors (or perhaps the same people) purchased common shares from the company. The cumulative amount that they put in is $497,000. The third form of investment takes place when the owners of the company leave the profits of the company in the business rather than taking the money out of the company in the form of dividends. The cumulative amount of this reinvestment is represented on the balance sheet by the retained earnings of $1,357,000.
19. Preferred Stock, $150,000
Holders of this class of stock receive priority in the payment of returns on their investment, called dividends. Preferred stock carries less risk than common stock (to be discussed next) because the dividend payment is fixed and must be made before any profit is distributed (dividends are paid) to the holders of common stock. Holders of preferred shares will also have priority over common shareholders in getting their funds back if the firm is liquidated in a bankruptcy. The holders of preferred shares are not considered owners of the business. Hence, they generally do not vote for the company’s board of directors. However, a corporate charter might provide that they do get to vote if the preferred dividend is not paid for a certain period of time. Although preferred shares are sometimes perceived as a ‘‘debt’’ of the company without a due date, they are not actually a debt of the company, but rather are part of equity. Because the preferred dividend is not an obligation of the company, unlike the interest paid on long-term debt, these securities are considered to have a higher risk than long-term debt. Because of this higher risk, the dividend yield on preferred stock will usually be higher than the interest rate that the company pays on long-term debt.
20. Common Stock, $497,000
The owners of common stock are the owners of the business. This balance sheet line represents the total amount of money that people have invested in the business since the company began. It includes only those stock purchases that were made directly from the company. The amount shown is the historic amount invested, not the current market value of the shares. In most cases, for each share owned, the holder is entitled to one vote for members of the board of directors. There are some companies that have different classes of common stock with different numbers of votes per share. This explains why some families or individuals are able to control very large corporations even though they actually own a small minority of the shares.
21. Retained Earnings, $1,357,000
Whenever a company earns a profit for the year, the owners are entitled to remove those funds from the company for their personal use. It is, after all, their money. Profits that are distributed to the stockholders are called dividends. However, if the business is in need of funds to finance expansion or to take advantage of other profitable opportunities, the owners may leave all or part of their profit in the company. The portion of total profits of the company that the owners have reinvested in the business during its entire history is called retained earnings. Collectively, preferred stock, common stock, and retained earnings are known as stockholders’ equity, or the net worth of the business.
23. Total Liabilities and Stockholders’ Equity, $3,202,000
On most balance sheets, the accountants will total the liabilities and stockholders’ equity. Notice that this amount is equal to the total amount of the assets. While this is something of a format consideration, it does have some significance that we can review here.
The balance sheet equation (Assets – Liabilities = Equity) is always maintained throughout the entire accounting process. This equation is never out of balance. If a company stopped recording transactions at any point in time and added up the numbers, assets minus liabilities would be equal to stockholders’ equity. The balance sheet equation also holds for any business or personal transaction. You cannot buy a house (asset)for $200,000 unless the combination of the amount you can borrow (liabilities) and the amount you have in your own funds (equity) is equal to $200,000.
Assets = Liabilities + Equity : $200,000 = $150,000 + $50,000
If you can borrow only $150,000 and you don’t have $50,000 in cash, you cannot buy the house for $200,000. This analogy is exactly applicable to business transactions and the corporate balance sheet.
Types of Short-Term Debt
Revolving Credit. This is a short-term loan, usually from a commercial bank. While it is often ‘‘callable’’ by the bank at any time, meaning that the bank can require its repayment, it often remains open for extended periods of time. It is usually secured by the company’s accounts receivable and inventory. Some banks require that the company pay off this loan for at least one month during the year, probably during its most ‘‘cash rich’’ month. Such a loan may also be called a working capital loan.
Zero-Balance Account. This type of short-term working capital loan has a very specific feature: Customer payments go directly to the bank, which uses the funds to reduce the outstanding loan, which benefits the company by reducing its interest expense. When the company writes checks, the bank deposits enough funds in the company’s account to cover the payments, increasing the outstanding loan. Hence the checking account always has a zero balance.
Factoring. This is a short-term working capital financing technique in which the company actually sells its accounts receivable to the bank or to a firm called a factoring company. Customers make payments directly to the bank, which actually owns the receivables. This is a fairly expensive form of financing, often costing 2 to 4 percent per month. Sometimes the sale of the accounts receivable is ‘‘without recourse.’’ This means that the bank assumes the credit risk of collecting the funds from the company’s customers.
Types of Long-Term Debt
There are several kinds of securities that a company can issue in order to acquire debt financing for extended periods of time. The maturity of these securities is always more than one year and can be as much as thirty or forty years, or even longer. The interest on these securities is known as the coupon rate.
Debentures. Debentures are corporate bonds whose only collateral is the ‘‘full faith and credit’’ of the corporation. In a bankruptcy, holders of these bonds would be general creditors. Debentures usually pay interest quarterly or semiannually.
Mortgage Bonds. Mortgage bonds are similar to debentures, except that the collateral on the loan is specific assets, usually real estate. The holders of these securities are said to be ‘‘secured lenders’’ because of the specified collateral.
Subordinated Debentures. These are exactly the same as debentures except that, in case of bankruptcy, holders of these securities must wait until all holders of mortgage bonds and debentures have been financially satisfied. Hence their lien on the company’s assets is ‘‘subordinated.’’
Convertible Bonds. These bonds are the same as debentures except that their holders have the option of turning them in to the company in exchange for a specified number of shares of common stock (converting them). Because there is an ‘‘upside’’ growth opportunity for holders of this security (since if the price of the company’s stock goes up, the shares into which the bond is convertible will increase in value), the coupon rate will usually be much lower than the rate on a regular debenture. The common stock price at which conversion is worthwhile is often called the strike price. It is much higher than the stock price at the time the bonds are originally issued.
Zero-Coupon Bond. This is a bond with a long maturity, probably 10 to 20 years. It is very different from other bonds in that the company pays no annual interest. Instead, it sells the bond at a significant discount from full value. Since the buyer receives the full value of the bond at maturity, the buyer is effectively earning ‘‘interest’’ each year as the value of the bond increases. For example, a 10-year, $1,000 bond with a 9 percent interest rate will be sold for $422.40, which is its present value, or the amount that, if invested at 9 percent, would equal $1,000 in 10 years. If the buyer holds this bond for 10 years, the company will pay the buyer the full $1,000. The buyer benefits because, in effect, the interest payments are also invested at the coupon rate, in this case 9 percent, and so the effective interest rate will be slightly higher than that on a regular debenture. Pension funds that don’t need the annual cash income find this attractive. (However, income taxes may have to be paid on the interest each year, even though no cash is received, so other investors may find this feature less attractive.) The seller enjoys the fact that no annual interest payments need be made, giving the firm many years to grow its business. Of course, the company must repay the full $1,000 at maturity.
THE INCOME STATEMENT DESCRIBES
THE performance of the company over a period of time, usually a month or a year. Often called a statement of operations or a profit and loss statement (P&L), this document measures the company’s achievement (revenue) and also the resources (expenses) that were expended in order to produce that achievement. The income statement is summarized as follows:
Revenue – Expenses = Profit
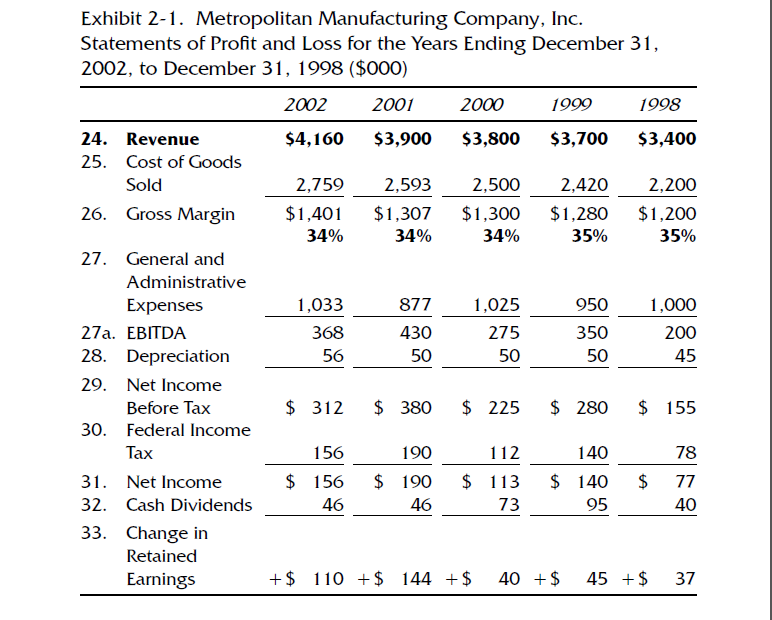
The difference between revenues achieved and expenses incurred is called profit or net income. The following paragraphs describe the details of the income statement. As a reference, we have provided a five-year history of the Metropolitan Manufacturing Company in Exhibit 2-1. This is part of the same set of financials as the balance sheet. The numbers refer to the line numbers on the income statement.
Revenue, $4,160,000
This is the dollar amount of products and services that the company provided to its customers during the year. This is often called sales; in Great Britain, it is called turnover or income. A sale is achieved when the customer takes ownership of and/or responsibility for the products.
Achieving revenue is quite distinct from ‘‘making a sale.’’ You might use the latter phrase when you and the customer agree to terms. You might say that you have made the sale when you receive the purchase order. However, revenue is not recorded until the customer has received and approved of the products or services purchased. Revenue is the value of products or services that are delivered to a satisfied customer. The customer either pays cash or promises to pay in the future; in the latter case, the amount is recorded as accounts receivable. Be clear that earning revenue is not the same as receiving cash for products and services. Cash can be received prior to the recordingof revenue.For example, a customer may make a down payment or deposit or may pay in advance for a magazine subscription. More commonly, however, businesses receive cash after the revenue is earned, resulting in accounts receivable. One type of business in which the receipt of cash and the recording of revenue might occur at the same time is the checkout counter at a supermarket. The amount of revenue achieved by Metropolitan Manufacturing Company is $4,160,000. This is after reductions for price discounts and allowances for possible returns and warranties. For example:
Gross Amount at List Price $4,310,881
– Price Discounts – 86,218 (2.0%)
– Allowances for Returns and Warranties – 64,663 (1.5%)
= Revenue $4,160,000
Companies record their revenues in this detail in order to monitor their price discounting practices and other reductions from revenue.
Cost of Goods Sold, $2,759,000
Cost of goods sold is the cost of producing or purchasing the goods that are delivered to customers. This amount is subtracted from revenue in order to determine gross margin or gross profit. Cost of goods sold includes the following elements:
- Raw materials
- Purchased components
- Direct labor (this includes the wages and other payments made to those who actually manufactured the product, and possibly their direct supervisors)
- Operating and repairing the equipment used to manufacture the product
- Other manufacturing expenses, including utilities and maintenance of the production facility
The amount recorded for cost of goods sold is related to the difference between expenses and expenditures. Cost of goods sold (an expense) is not the same as cost of production (an expenditure) because of changes in inventory. If inventory levels decrease during the period, then the cost of goods sold will be higher than the cost of production by the amount of the change in inventory.
Gross Margin, $1,401,000
This measures the profitability achieved as a result of producing and selling products and services. It measures manufacturing efficiency and the desirability of the company’s products in the marketplace. Gross margin percentage is another measure of that performance.
General and Administrative Expenses, $1,033,000
This amount represents the cost of operating the company itself. Included in this category are staff expenses (accounting, computer operations, senior management), selling expenses (salaries, travel), promotional expenses (advertising, trade shows) and research and development (technological research).
Depreciation Expense, $56,000
This is the portion of prior capital expenditures that has been allocated to the current year and is recorded as an expense in that year. It does not represent a cash expenditure.
Net Income Before Tax, $312,000
This amount is equal to revenue minus all operating and nonoperating expenses incurred by the company. For Metropolitan Manufacturing Company, it is:
Revenue $4,160,000
– Cost of Goods Sold 2,759,000
– General and Administrative Expenses 1,033,000
– Depreciation Expense 56,000
$3,848,000
= Net Income Before Tax $ 312,000
Federal Income Tax, $156,000
In the United States, corporations pay approximately 34 percent of their profit to the federal government in the form of income taxes. For the Metropolitan Manufacturing Company example, however, to simplify the calculations, we used a rate of 50 percent.
Net Income, $156,000
This is the amount of profit that the corporation has achieved during the year. All expenses related to purchases from vendors and all other operating expenses have been taken into account. The owners of the business may take this profit for their personal use (dividends) or reinvest all or part of it in the corporation to finance expansion and modernization (retained earnings).
Cash Dividends, $46,000
This is the portion of the year’s profits that was distributed to the owners of the business. The remainder (the portion that was not paid to the owners) was retained in the business. Therefore:
Net Income $156,000
– Cash Dividends $ 46,000
= Increase in Retained Earnings $110,000
Change in Retained Earnings, $110,000
This represents the portion of the profits that the owners reinvested in the business in the year 2002. The cumulative amount that the owners have reinvested in the business since its inception is $1,357,000. This is the cumulative retained earnings; it appears on the balance sheet on line 21. Notice on the balance sheet that line 21 increased by $110,000 in 2002, which represents that year’s reinvestment.
The Statement of Cash Flows
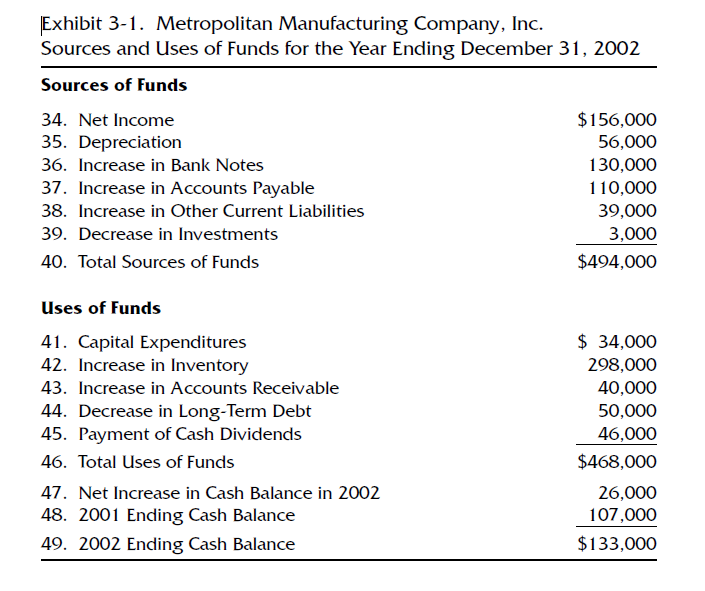
THE THIRD CRITICAL FINANCIAL STATEMENT, along with the balance sheet and the income statement, is called the statement of cash flows. In the past it was called the sources and uses of funds statement, which is a more accurate description of the information it contains. It describes in summary form how the company generated the cash flows it needed (sources) to finance its various financial opportunities and responsibilities (uses) during the past year. The sources and uses of funds statement for Metropolitan Manufacturing Company is shown in Exhibit 3-1. As you go through it, notice that the line items appear on the balance sheet in the column labeled ‘‘Changes.’’ In fact, the sources and uses of funds statement describes the changes in the balance sheet between two successive years, in this case 2002 and 2001. What we will do in this case is:
1. Present a sources and uses of funds statement.
2. Discuss the meaning of each number.
3. Describe how each number was developed, relating it back to its source on the balance sheet.
4. Restate the numbers in the statement of cash flows format.
Sources of Funds
Net Income, $156,000
The company’s profits are a major source of funds. Therefore, net income is traditionally listed first. This number is also the ‘‘bottom-line’’ number in the income statement (line 31). In addition, it strongly affects the retained earnings amount on the balance sheet (line 21). Net income causes retained earnings to increase. Payments of cash dividends cause retained earnings to decrease. Therefore, the $110,000 change in retained earnings (income statement, line 33) is the net of:
Net Income $156,000 (31 and 34)
– Dividends – 46,000 (32)
= Change in Retained Earnings $110,000 (33)
Depreciation Expense, $56,000
In a more formal version of this statement, this item would be preceded by the heading ‘‘Add Back Items Not Requiring the Disbursement of Cash.’’ The explanation of this is related to the discussion of expenses and expenditures. When net income was calculated, an expense item was subtracted (line item 28) that did not require a cash expenditure during this period and will never require one in the future. The item is depreciation expense. The expenditures related to this expense—i.e., capital expenditures—have already taken place. The depreciation expense was subtracted on line 28 for two reasons. First, generally accepted accounting principles (GAAP) require this. Second, depreciation expense is deductible as an expense for corporate income tax purposes, and so including it provides tax benefits. However, for the purposes of the sources and uses of funds statement, it is added back because in terms of cash, it was not a ‘‘real’’ subtraction during this period.
Increase in Bank Notes, $130,000
During the year, Metropolitan Manufacturing Company raised $130,000 through additional short-term bank financing. This was added to its previously existing short-term bank debt of $170,000. Notice that Metropolitan added to its short-term debt while also paying off some long-term debt. By its very definition, the long- term amount that was paid off was not due. If it had been due, it would have been classified as ‘‘current portion of long-term debt,’’ which is a current liability. There could be several explanations for this financing strategy, but it probably was related to the difference between short-term and long-term interest rates. Metropolitan probably borrowed short-term funds at a lower interest rate and used some of the funds to reduce its long-term loan, which had a higher interest rate.
Increase in Accounts Payable, $110,000
When a company buys products and services on credit, the purchases are being financed by the supplier, who provides the product or service but does not receive payment for it at that time. Overall, an increase in accounts payable shows that the company is making more purchases on credit, and so is being financed by its suppliers to a greater degree. This is not an analysis of the strategy of buying on credit, which considers having vendors finance purchases or extending payment periods to lengthy terms as a cheap source of cash. In an accounting report like this one, it is merely a statement that the amount of accounts payable is larger than in the past. An increase in accounts payable can result from the following actions:
- Taking more time to pay bills
- Buying more products on credit
- Paying higher prices for credit purchases
Increase in Other Current Liabilities, $39,000
Any increase in a liability is a source of funds. Since this category is primarily made up of accruals and similar items, it naturally increases each year as the company gets larger.
Decrease in Investments, $3,000
The company sold some investments that were on the books for $3,000. These investments could have been bonds, long-term certificates of deposit, or possibly the common stock of another company.
Total Sources of Funds, $494,000
This is the sum of:
Net Income $156,000
Depreciation 56,000
Increase in Bank Notes 130,000
Increase in Accounts Payable 110,000
Increase in Other Current Liabilities 39,000
Decrease in Investments 3,000
$494,000
Uses of Funds
Capital Expenditures, $34,000
The company used $34,000 to add to its fixed assets. This is evidenced by the increase in the gross book value of fixed assets. Since assets are presented at the lower of cost or market, the only explanation for an increase in gross book value is the purchase of fixed assets.
Increase in Inventory, $298,000
While inventory is sold and replenished many times during the course of the year, on a net basis, Metropolitan has invested an additional $298,000 in inventory. The increase in the level of inventory could be the result of any combination of the following:
- Replacement costs are greater than the cost of what was sold.
- Costs have remained the same, but the number of units in inventory has increased.
- The mix of products on hand has changed in the direction of more expensive products.
It cannot be determined simply from the inventory numbers whether inventory increased because sales forecasts were overly optimistic or sales were disappointing. We do not know if it was raw materials, work in process, or finished goods inventory that increased. Analysis of these issues will be necessary. The only thing that is certain is that the financial investment in inventory has increased.
Increase in Accounts Receivable, $40,000
The company has ‘‘invested’’ this additional amount in financing its customers. This many be the result of any of the following:
- Higher sales levels
- More generous credit terms
- A deterioration in collection performance
Providing customers with credit is a marketing investment that, the company hopes, will produce more and happier customers who purchase more product. However, not enforcing credit agreements is a sign of either accounting sloppiness or marketplace weakness (fear that customers would not buy if they could not take their time in paying).
Decrease in Long-Term Debt, $50,000
Metropolitan Manufacturing Company used $50,000 to reduce its long-term debt. The rules of accounting provide strong evidence that this was a voluntary act. Long-term debt by definition is not due within the current year. As mentioned in the discussion of the increase in short-term debt, if this amount had been due, it would have been classified as a current liability, most likely current portion of long-term debt. This payment could have been made because of any combination of the following:
- The interest rates on the long-term debt were high.
- The company had extra cash.
- The company used the proceeds from lower-cost short- term bank debt.
Payment of Cash Dividends, $46,000
The board of directors of Metropolitan Manufacturing Company voted to pay the holders of preferred and common shares cash dividends amounting to $46,000. Such dividends are traditionally but not necessarily voted on and disbursed on a quarterly basis. Notice that Retained Earnings on the balance sheet (line 21) was affected by two activities, net income and cash dividends, as follows:
Retained Earnings, 12/31/01 $1,247,000
Plus: Net Income, 2002 $156,000
Minus: Cash Dividends, 2002 – 46,000
Equals: Change in Retained Earnings, 2002 $110,000
Retained Earnings, 12/31/2002 $1,357,000
Total Uses of Funds, $468,000
This is the sum of:
Capital Expenditures $34,000
Increase in Inventory 298,000
Increase in Accounts Receivable 40,000
Decrease in Long-Term Debt 50,000
Payment of Cash Dividends 46,000
$468,000
Cash Reconciliation
Beginning Cash Balance $107,000
Plus: Sources of Funds: $494,000
Minus: Uses of Funds: – 468,000
Equals: Increase in Cash + 26,000
Ending Cash Balance: $133,000